Statistics
Accurate statistics showing the number of animals killed by the fur trade each year are notoriously difficult to get hold of and published figures from the fur trade may not be accurate.
The other reason that the statistics can never be accurate is the constantly changing nature of the fur trade. Economics volatility as well as the vagaries of fashion mean that the overall demand for fur and for the fur of different species shifts all the time. You only have to look at the situation in Greece (a significant fur dealing and retail country) to see how significant this factor can be.
However, recent reports from around the world do reveal the true horror of the scale of the international fur trade.

FUR FACTORY FARMING
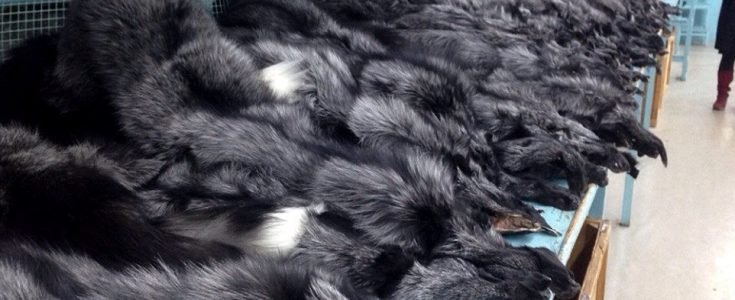
Most of the fur skins used by the trade come from fur factory farms and are purchased at the many fur auctions that take place around the world each year. One of the largest of these is the Kopenhagen Fur sale and at its last event of the season this year (September 2015), 6.9 million mink skins will be put up for sale.
The auction houses to provide a source for estimates of the numbers of animals killed each year. As an insight into the way those involved with the fur trade think, they refer to these dead animals as a ‘crop’. Accordingly, Kopenhagen Fur estimates this year’s (2014-2015) crop figures will be:
Mink – approximately 70 million (down from the 2013-2014 figure of 81.2 million)
| Country | No. Of mink, 2014-15 |
| China | 20,000,000 |
| Denmark | 18,000,000 |
| Poland | 9,000,000 |
| USA | 4,500,000 |
| Canada | 3,000,000 |
| Eastern Europe (excluding Poland) | 6,000,000 |
| Greece | 2,000,000 |
According to these figures, almost half of all mink bred and killed for their fur come from countries that are members of the European Union.
These extremely large numbers translate to something more manageable. The fact is that, in effect, 2 mink are killed for every second of every minute of every day of the year – just for the skins off their backs.

Fox Breeding.
Again, using fur trade sources the following table can be produced which shows that a half of all fox bred for their fur come from EU countries with Finland accounting for nearly all of them.
| Country | No. Of fox, 2010 |
| Finland | 1,800,000 |
| China | 1,400,000 |
| Norway | 200,000 |
| Poland | 100,000 |
| Russia | 100,000 |
| Rest of world | 100,000 |
| TOTAL | 3,700,000 |
 TRAPPING
Most fur from animals trapped in the wild comes from USA, Canada and Russia. Statistics are even more difficult to obtain and/or unreliable than for factory farmed skins. Any published figures do not include the significant numbers of animals trapped and discarded either because their fur has no value to the trapper or the animals are from endangered species and their deaths could lead to prosecution so the evidence is concealed.
Canada used to produce annual statistics recording how many animals pelts are produced and sold each year but stopped publishing this data in 2012 due to government cut backs. The latest (and last) figures available are for 2009 when 730, 915 wild animal pelts were sold for a total of CAN$14,847,952.
This total included:
265,071 muskrat
139,220 beaver
47,340 coyote
92,959 marten
32,072 raccoon
2,055 black or brown bear
9,405 otter
2,867 wolf
In the US, no federal statistics are produced and the last time a thorough analysis of the number of animals trapped in all 50 states was carried out was for the 1998-99 trapping season.
| Species | Number trapped in US in 1998-99 |
| Badger | 6,750 |
| Beaver | 333,132 |
| Black bear | 59 |
| Bobcat | 24,070 |
| Coyote | 154,660 |
| Fisher | 8,441 |
| Fox, Arctic | 208 |
| Fox, Gray | 77,334 |
| Fox, Red | 130,082 |
| Fox, Kit/Swift | 444 |
| Lynx | 2,785 |
| Marten | 9,013 |
| Mink | 147,598 |
| Muskrat | 1,426,857 |
| Nutria | 131,271 |
| Opossum | 227,365 |
| Otter | 17,614 |
| Racoon | 1,846,649 |
| Ringtail | 4,174 |
| Skunk | 77,624 |
| Weasel | 7,941 |
| Wolf | 1,495 |
| Wolverine | 505 |
| TOTAL | 4,636,081 |
The best current estimate is that 3-5 million animals are trapped each year in the US.
CANADIAN SEAL HUNT

Canadian harp seal hunt Total Allowable Catch (TAC) figures set by the Canadian government and total number of seals killed:
| YEAR | TAC – HARP SEALS | ACTUAL CATCH |
| 2015 | 400,000 | 35,304 * |
| 2014 | 400,000 | 54,600 |
| 2013 | 400,000 | 90,318 |
| 2012 | 400,000 | 69,175 |
| 2011 | 400,000 | 37,609 |
| 2010 | 330,000 | 61,000 |
| 2009 | 280,000 | 91,000 |
| 2008 | 275,000 | 217,636 |
| 2007 | 270,000 | 224,745 |
| 2006 | 375,000 | 354,867 |
| 2005 | 319,500 | 329,829 |
| 2004 | 350,000 | 365,971 |
| 2003 | 289,512 | 289,512 |
| 2002 | 275,000 | 312,367 |
| 2001 | 275,000 | 226,493 |
| 2000 | 275,000 | 92,068 |
| 1999 | 275,000 | 244,603 |
| 1998 | 275,000 | 282,624 |
| 1997 | 275,000 | 264,210 |
| 1996 | 250,000 | 242,906 |
| 1995 | 186,000 | 65,767 |
| 1994 | 186,000 | 61,379 |
| 1993 | 186,000 | 27,003 |
| 1992 | 186,000 | 68,668 |
| 1991 | 186,000 | 52,588 |
| 1990 | 186,000 | 60,162 |
| 1989 | 186,000 | 65,304 |
* In 2015, 910 grey seal pups were also killed.


